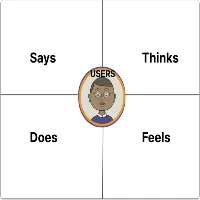
Empathy Mapping 2024. Empathy maps typically consist of four quadrants: Says, Thinks, Does, and Feels, with the user or persona positioned in the center. These maps offer a comprehensive view of the user’s characteristics and experiences, capturing their thoughts, actions, emotions, and verbal expressions. It’s important to note that empathy maps are not organized chronologically or sequentially but provide a holistic snapshot of the user’s perspective. Empathy Mapping 2024
In the “Says” quadrant, you’ll find direct quotes from the user obtained during interviews or usability studies. These quotes are ideally verbatim and provide insight into the user’s thoughts and preferences. For example:
Says
- “I’m loyal to Delta because I’ve never had a bad experience.”
- “I’m looking for something dependable.”
- “I prefer using Apple products because they’re user-friendly.”
- “I find the navigation menu confusing and hard to use.”
- “I often share my experiences with friends on social media.”
- “I wish there was a faster way to complete this task.”
- “I feel overwhelmed by the number of options available.”
- “I love the simplicity of this app.”
- “I’m frustrated with the checkout process—it’s too complicated.”
- “I always check reviews before making a purchase.”
- “I wish there were more customization options.”
- “I find the customer support very helpful and responsive.”
Thinks
In the “Thinks” quadrant, we delve into the user’s internal thoughts and considerations during the experience. This section reflects on what occupies the user’s mind and what truly matters to them. Sometimes, it may overlap with what the user vocalizes in the “Says” quadrant, but it often uncovers thoughts the user may not openly express. It’s essential to understand why users may hesitate to share certain thoughts—whether due to uncertainty, self-consciousness, politeness, or fear of judgment. For example:
- “This is frustrating.”
- “Am I missing something? Why is this so difficult?”
- “I wonder if there’s a better way to do this.”
- “Is this feature really necessary?”
- “I hope I’m not the only one struggling with this.”
- “I wish there were more clear instructions.”
- “I’m concerned about the security of my data.”
- “I’m not sure if I trust this website with my credit card information.”
- “I wish there was a faster way to complete this task.”
- “I wonder if there are any hidden fees.”
- “I hope I’m making the right decision.”
- “I’m curious about how this product compares to competitors.”
Does
In the “Does” quadrant, we focus on the user’s observable actions and behaviors during the experience. This section highlights what the user physically does and how they approach tasks or activities. It captures concrete actions based on research observations. For example:
- “Refreshes the page multiple times.”
- “Browses different websites to compare prices.”
- “Clicks on the ‘Add to Cart’ button without hesitation.”
- “Scroll through product reviews before making a purchase decision.”
- “Navigates back and forth between different sections of the website.”
- “Enters search queries using specific keywords to find desired information.”
- “Share product links with friends on social media for their opinions.”
- “Adds items to the wishlist for future consideration.”
- “Uses the filter options to narrow down search results.”
- “Subscribes to the newsletter for updates and promotions.”
- “Leaves feedback or reviews after completing a transaction.”
- “Shares personal experiences and recommendations in online forums.”
Feels
In the “Feels” quadrant, we explore the user’s emotional state and how they feel about the experience. This section provides insights into the user’s emotional responses, concerns, and excitement. It’s important to consider what worries the user, what excites them, and their overall emotional experience. For example:
- Impatient: “Frustrated by slow page loading times.”
- Confused: “Overwhelmed by contradictory prices.”
- Anxious: “Concerned about the security of personal information.”
- Indecisive: “Feeling overwhelmed by too many options.”
- Satisfied: “Happy with the smooth checkout process.”
- Disappointed: “Unhappy with the lack of product variety.”
- Relieved: “Glad to find clear and straightforward instructions.”
- Overwhelmed: “Feeling stressed by complex navigation.”
- Excited: “Eager to explore new features and functionalities.”
- Skeptical: “Doubtful about the reliability of product reviews.”
- Hopeful: “Optimistic about finding a solution to their problem.”
- Frustrated: “Annoyed by unexpected errors during the checkout process.”
By incorporating these additional considerations into your empathy mapping process, you can create more impactful and insightful representations of the user’s experience, leading to more effective and user-centered design solutions. Empathy Mapping 2024
UX Laws 2024 - Digital AniViPractice
[…] UX design, “UX laws 2024” are principles, guidelines, or heuristics that serve as fundamental rules to […]